How five Kuala Lumpur highrise buildings price, and where each sits in its cycle.Illustration · Pau Analytics
Property valuation
What Influences Property Price
Where five highrise buildings sit in their price cycle
Pau AnalyticsAnalyst reportKL highrise · five buildings
Five highrise buildings in Kuala Lumpur, bought and sold over three decades, share one market and, at a glance, one story: a steady climb that carries them upward together. A single average across their sales seems to describe every one, which makes that story easy to accept. This report reads 249 of those sales, one building at a time, to test that story and to show what really sets each building's price.
Two findings make the answer surprising. The five hardly move together at all: three of the buildings have eased while only one is still climbing, so the market average flatters most of them. And age barely matters, because the dearest building of the five is one of the oldest while the newest sits near the bottom. What follows is where each building stands, what moves its price, and a worked value for a unit in every one.
The numbers
249 sales
across five buildings, 1986–2019
89%
of price differences explained
3 of 5
buildings falling, only one rising
6×
rate gap, dearest vs cheapest building
“Pooled together, the five look like they rose about 4% a year. That single number is carried by one building and hides that most are flat or falling.”
What the numbers show
Executive summary
For anyone putting a price on a unit here, the consequence is that these five cannot share one rate or one trend. Property 3 is dear and still rising, Property 2 is dear but has levelled off, and Property 1, Property 4 and Property 5 are all easing, Property 1 despite being the newest of the five. A rate or a trend taken from the market as a whole would misprice almost every one.
Two adjustments carry most of the weight in pricing these buildings, and the data gives each a clear direction. On timing, an upward move for the passage of time fits Property 3, which is still rising, while Property 2 has held level and Property 1, Property 4 and Property 5 have eased. On the building itself, price tracks standing rather than age: Property 3, one of the oldest, is the dearest of all, while Property 1, the newest, sits near the bottom. Age is not the story; the address is.
The approach that follows is three steps: start from each building's own going rate, scale by the unit's floor area, and adjust for time in the direction that building is actually moving. Set out this way, the five resolve into five clear pricing problems, each answered below and each turned into a worked valuation at the end.
1. What sets a unit's price
How much does size shift price?
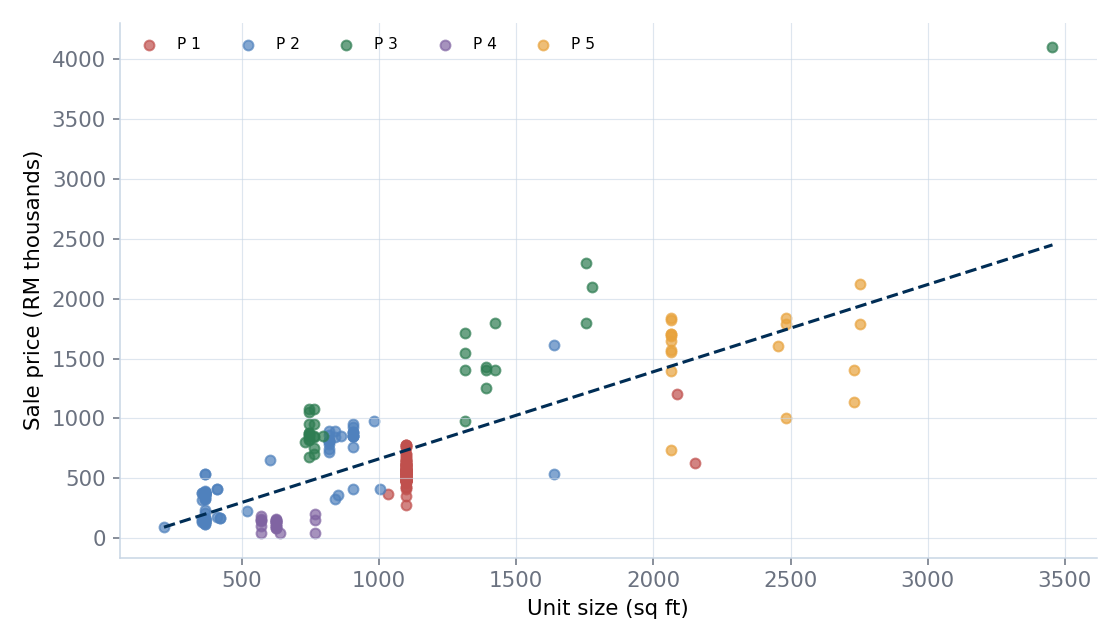
Sale price against unit size, all 249 sales. The line is nearly straight: more space, proportionally more money.
A unit's price follows its floor area almost exactly. Across all 249 sales, a unit that is 10% larger sells for about 11% more, the tightest relationship anywhere in the data. Floor area is the first and firmest thing that sets a price.
This holds in every building, whatever their rates, which is why area is the safe backbone of a valuation here. Property 5 trades in large units of around 2,070 square feet and Property 2 in small ones of around 370, with Property 1 near 1,100, Property 3 near 760 and Property 4 near 620, yet inside each the same rule applies: proportionally more space, proportionally more money.
Price a unit first on its size: take the building's going rate per square foot and multiply by the floor area. Everything else in this report is an adjustment sitting on top of that backbone, never a replacement for it.
Do bigger units cost less?
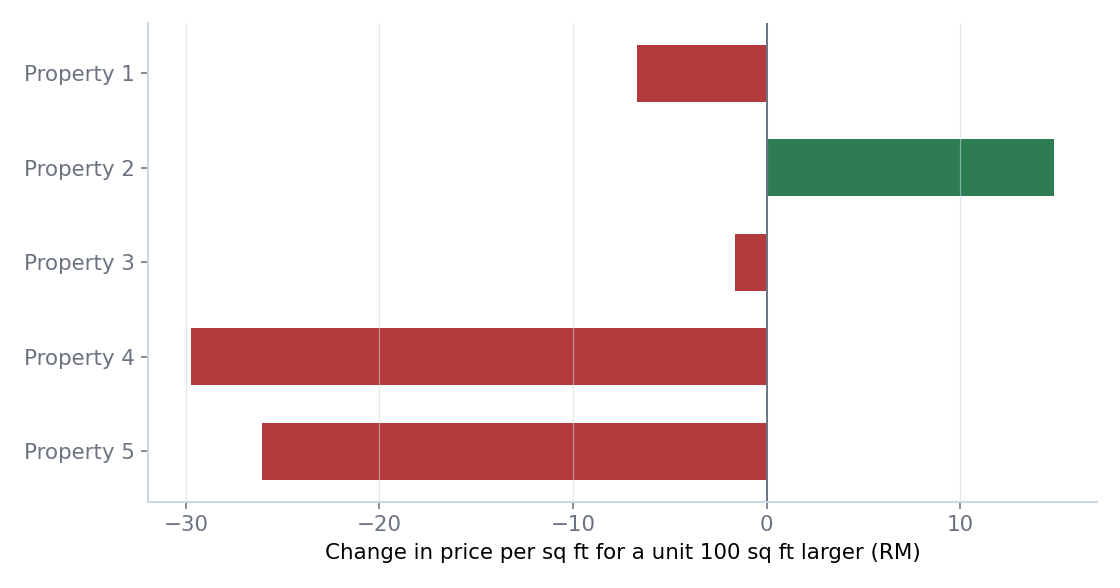
How the per-square-foot rate changes for a unit 100 sq ft larger, by building. The directions disagree, so there is no common rule.
Within a single building, the rate per square foot hardly changes as units get larger, and where it does change it does not change the same way everywhere. There is no one size adjustment that carries across all five buildings.
In Property 2 a larger unit carries a slightly higher rate, about RM15 more per square foot for each extra 100 square feet, while in Property 4 and Property 5 a larger unit is a little cheaper, by roughly RM30 and RM26. Property 1 eases gently, about RM7, and Property 3 is essentially flat. The direction of the size adjustment belongs to the building, not to the market as a whole.
Apply only the small, building-specific tilt where it exists: a touch up in Property 2, a touch down in Property 4 and Property 5, and none worth making in Property 1 or Property 3. Do not carry one building's size adjustment across to another.
2. Where each building stands
What is each building's going rate?
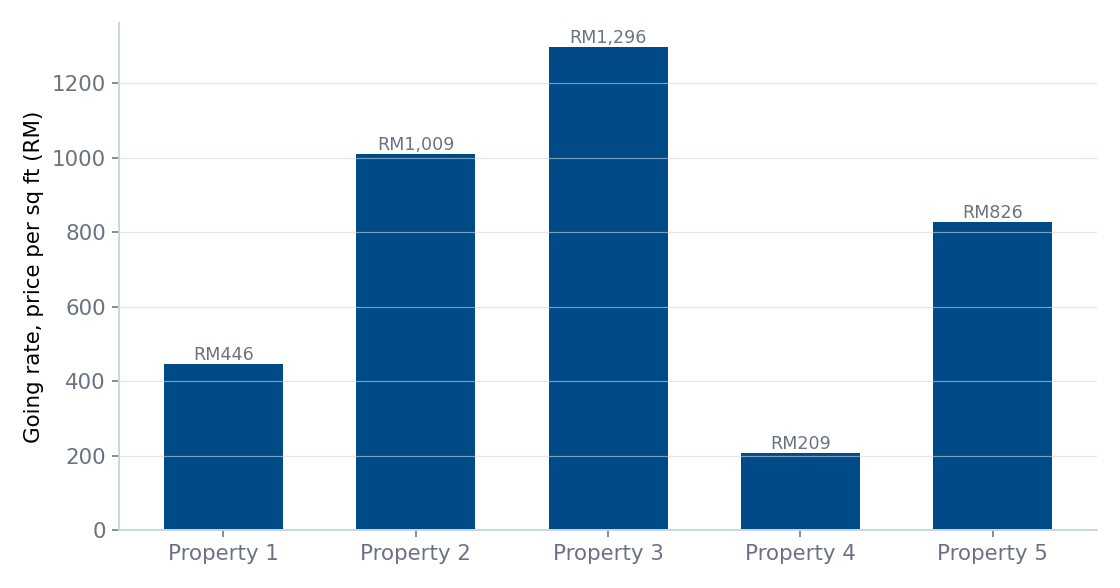
Going rate per square foot, size-adjusted, most recent sales. The starting point for any valuation.
Stripped of unit size and read at today's market, the five buildings sit far apart. Property 3 is the dearest at about RM1,300 per square foot, then Property 2 at about RM1,010, Property 5 at about RM830, Property 1 at about RM450, and Property 4 the cheapest at about RM210.
These rates are the anchor a valuer starts from, and the spread is wide: the top building trades at more than six times the rate of the bottom one. Even the gap between the two dearest, Property 3 and Property 2, is about RM290 per square foot, enough to swing a mid-sized unit by a quarter of a million ringgit.
Start from each building's own going rate, never a blended market average. A single area rate applied across these five would overprice Property 1 and Property 4 and underprice Property 3 and Property 2 by a wide margin.
How fast is each building appreciating?
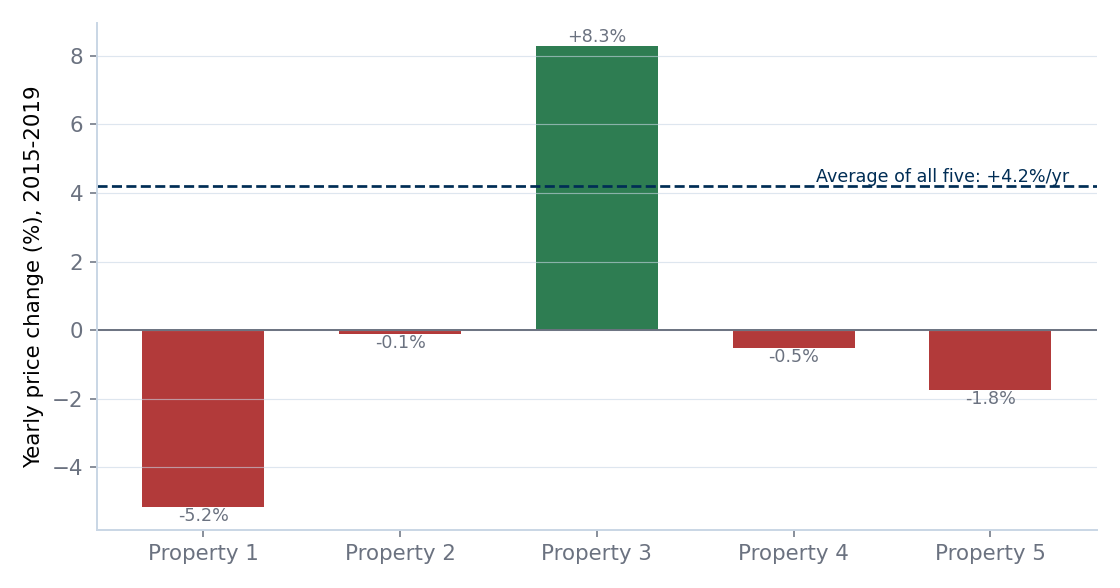
Yearly price change 2015–2019, size-adjusted. The dashed line is the misleading five-building average.
Only one of the five is genuinely rising. Property 3 has gained about 8% a year in recent years, while Property 2 has held flat, and Property 1, Property 4 and Property 5 have all lost ground, Property 1 by about 5% a year, Property 5 by about 2%, and Property 4 drifting slightly down.
Averaged together, the five look like they rose about 4% a year, the kind of number that makes "property always goes up" feel true. That average is carried almost entirely by Property 3 and hides that most of these buildings are flat or falling. Read from that market average alone, the timing adjustment would point up for four buildings that have actually moved down or sideways.
Treat appreciation as a building-by-building fact, not a market rule. Only Property 3 justifies revising an older comparable upward for the passage of time; for the other four, time is flat or works against the price.
Which buildings are peaking or sliding?
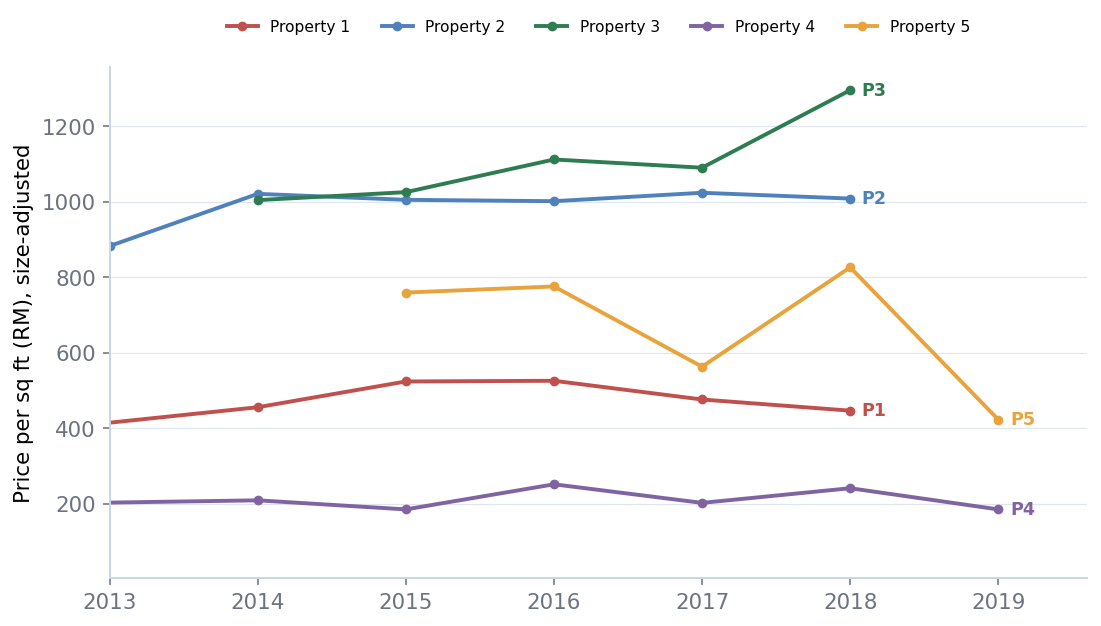
Size-adjusted price per square foot by year. Five buildings, five different paths through the cycle.
The five sit at different points of the price cycle. Property 3 is still climbing and has just set its highest level. Property 2 has plateaued after years of growth and now holds steady near the top. Property 1 has turned down from a 2016 peak and sits about 15% below it, while Property 4 drifts lower and Property 5 has dropped sharply from its 2018 high.
The most useful surprise is Property 1: it is the newest building of the five, yet it is the clearest faller, which cuts against the common expectation that a newer building holds its value. A building can look busy on sales volume while its price has quietly rolled over, and that is exactly what has happened here.
Let the stage set the direction of the time adjustment. Revise a comparable upward only in Property 3, leave it broadly as it stands in Property 2, and revise downward in Property 1, Property 4 and Property 5, most steeply in Property 5. Getting this direction wrong is the single largest pricing error available in these five buildings.
3. Why the buildings differ
Is it age, or the address?
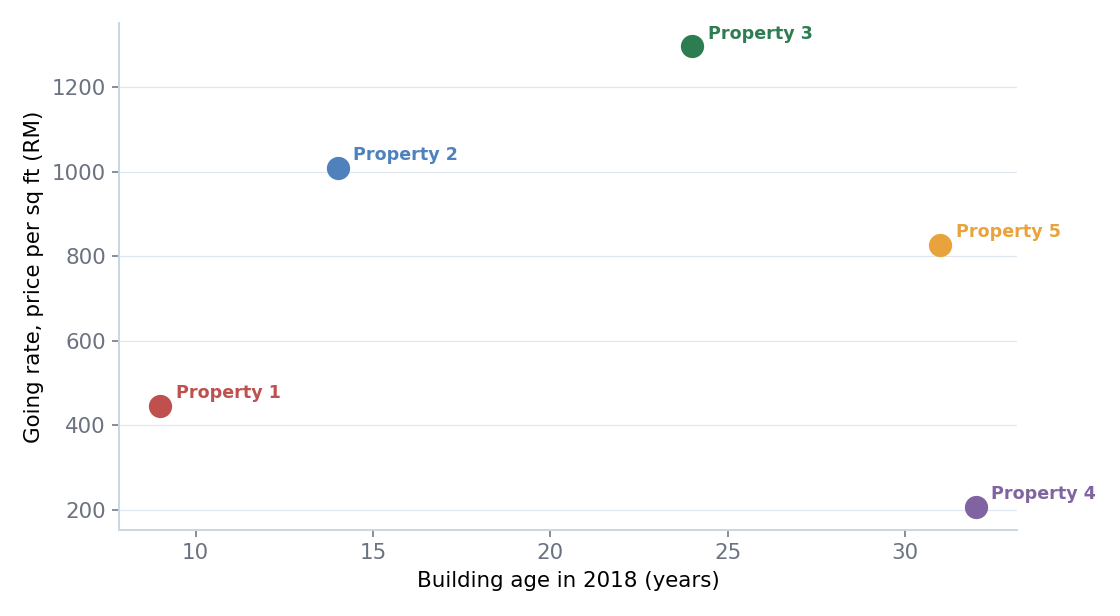
Going rate against building age. Older does not mean cheaper; the dearest building is one of the oldest.
Age does not set the price. Property 3 was completed in 1994 yet commands the highest rate of all five, while Property 1, finished in 2009 and the newest, sits near the bottom, and Property 4, the oldest at 1986, is the cheapest. Lined up across the five buildings, age and price show no real relationship.
What is left, once floor area, unit type and the passage of time are set aside, is the building itself: where it stands, how it is regarded, and the tier of buyer it draws. That standing is what separates Property 3 and Property 2 at the top from Property 1 near the middle and Property 4 at the bottom, with Property 5 in between. The year on the title deed explains none of it.
Judge a building on its address and standing, not its completion year. Do not discount Property 3 for its age, and do not pay up for Property 1 because it is new; this market rewards where a building is, not how recently it was built.
The valuation cookbook
Putting the findings together, each building has a simple recipe: start from its going rate, multiply by the unit's floor area, then adjust for time in the direction the building is moving. Below is a worked value for a standard, median-sized unit in each building at today's market, with the time rule a valuer applies to an older comparable. The two thinnest buildings, Property 4 and Property 5, rest on the fewest sales, so their values are shown as wider ranges.
Building
Standard unit
Going rate
Worked value
Stage · time rule
Property 3 (condo, 1994)
~760 sq ft
~RM1,300/sq ft
~RM990,000 (RM911k–1.07m)
Rising · revise an older sale up
Property 2 (service apt, 2004)
~370 sq ft
~RM1,010/sq ft
~RM370,000 (RM341k–400k)
Plateau · recent sales stand as they are
Property 5 (condo, 1987)
~2,070 sq ft
~RM830/sq ft
~RM1.71m (RM1.45m–1.96m)
Falling · price off the newest sale, wide range
Property 1 (condo, 2009)
~1,100 sq ft
~RM450/sq ft
~RM490,000 (RM451k–529k)
Falling · revise an older sale down
Property 4 (medium cost, 1986)
~620 sq ft
~RM210/sq ft
~RM130,000 (RM110k–149k)
Soft · use the median, wide range
What to do
1. Start from the building's own going rate (section 2). The five rates run from about RM210 to RM1,300 per square foot, so a blended market rate misprices both ends. Expected result: the largest single source of error removed at the first step.
2. Price on area times rate (section 1). A unit's price scales almost exactly with its floor area, and the per-square-foot rate barely bends with size. Expected result: simpler, more defensible unit adjustments, with only a small building-specific tilt where it exists.
3. Set the time adjustment by the building's stage, not the market (section 2). Up for Property 3, flat for Property 2, down for Property 1, Property 4 and Property 5. Expected result: the three falling buildings are not marked up when time is assumed to raise value.
4. Judge value by address, not age (section 3). No age discount on Property 3, no youth premium on Property 1. Expected result: valuations that match what buyers in this market actually pay for.
5. Widen the range for Property 4 and Property 5. Both rest on fewer than 25 sales, so their trends and values are less certain. Expected result: honest confidence, a stated range rather than false precision.
Where the numbers come from
The analysis uses 249 highrise sales across five buildings, spanning 1986 to 2019 with most sales from 2014 onward, and about RM162 million of transactions in all. Each sale carries its price, floor area, building, unit type and sale quarter. Two sales dated before their building was completed were set aside, and the five buildings were relabelled Property 1 to Property 5 in place of their real names.
Building, size and timing together account for about 89% of why prices differ, and allowing each building its own trend was what lifted the accuracy, confirming the five move separately rather than as one market. Size was tested directly and found to scale price almost exactly, with no rate premium for larger units. Property 4 and Property 5 rest on 22 and 18 sales, so their trends and values carry wider uncertainty and are shown as ranges. Each building's direction is clear; the exact turning point is not, so the stages describe direction, not a precise date.
The bottom line
Five highrise buildings that look like one market are really five separate pricing problems. Their rates run six to one, only one is rising while three are falling, and the dearest of them is one of the oldest. Averaging them together produces a tidy growth story that would misprice almost every one.
The way to price them is not a market rule but a building rule: start from each building's own going rate, scale by the unit's floor area, and move the price in the direction that building is actually heading. Age barely matters; the address is what buyers pay for.
Read this way, every adjustment carries a number and a reason: the building's own rate, the unit's floor area, and the direction the market has taken. That is what makes a valuation straightforward to explain and to stand behind.
Action list
Ranked by impact, tied to the findings above. Companion file: action-list.csv.
#
Action
How
Expected impact
1
Start from each building's own going rate
Use the building rate (RM210–1,300/sq ft), never a blended average
Removes the biggest pricing error at step one
2
Set the time adjustment by stage
Up for Property 3, flat for Property 2, down for Property 1, 4 and 5
Stops overpricing the three falling buildings
3
Price on area times rate
Multiply floor area by rate; no size premium beyond a small per-building tilt
Simpler, defensible unit adjustments
4
Judge value by address, not age
No age discount on Property 3, no youth premium on Property 1
Valuations match what buyers pay for
5
Widen the range on thin buildings
Show Property 4 and Property 5 as ranges, priced off the newest sales